


1719754427-0/Untitled-design---2024-06-30T183148-240-(1)1719754427-0.png "Who are ‘hot rodent boyfriends’? | The Express Tribune")


 distracting celebrity cameos on ‘The Bear’")


Main religious family by county
Source: 2020 U.S. Religion Census
DEPARTMENT OF DATA / THE WASHINGTON POST
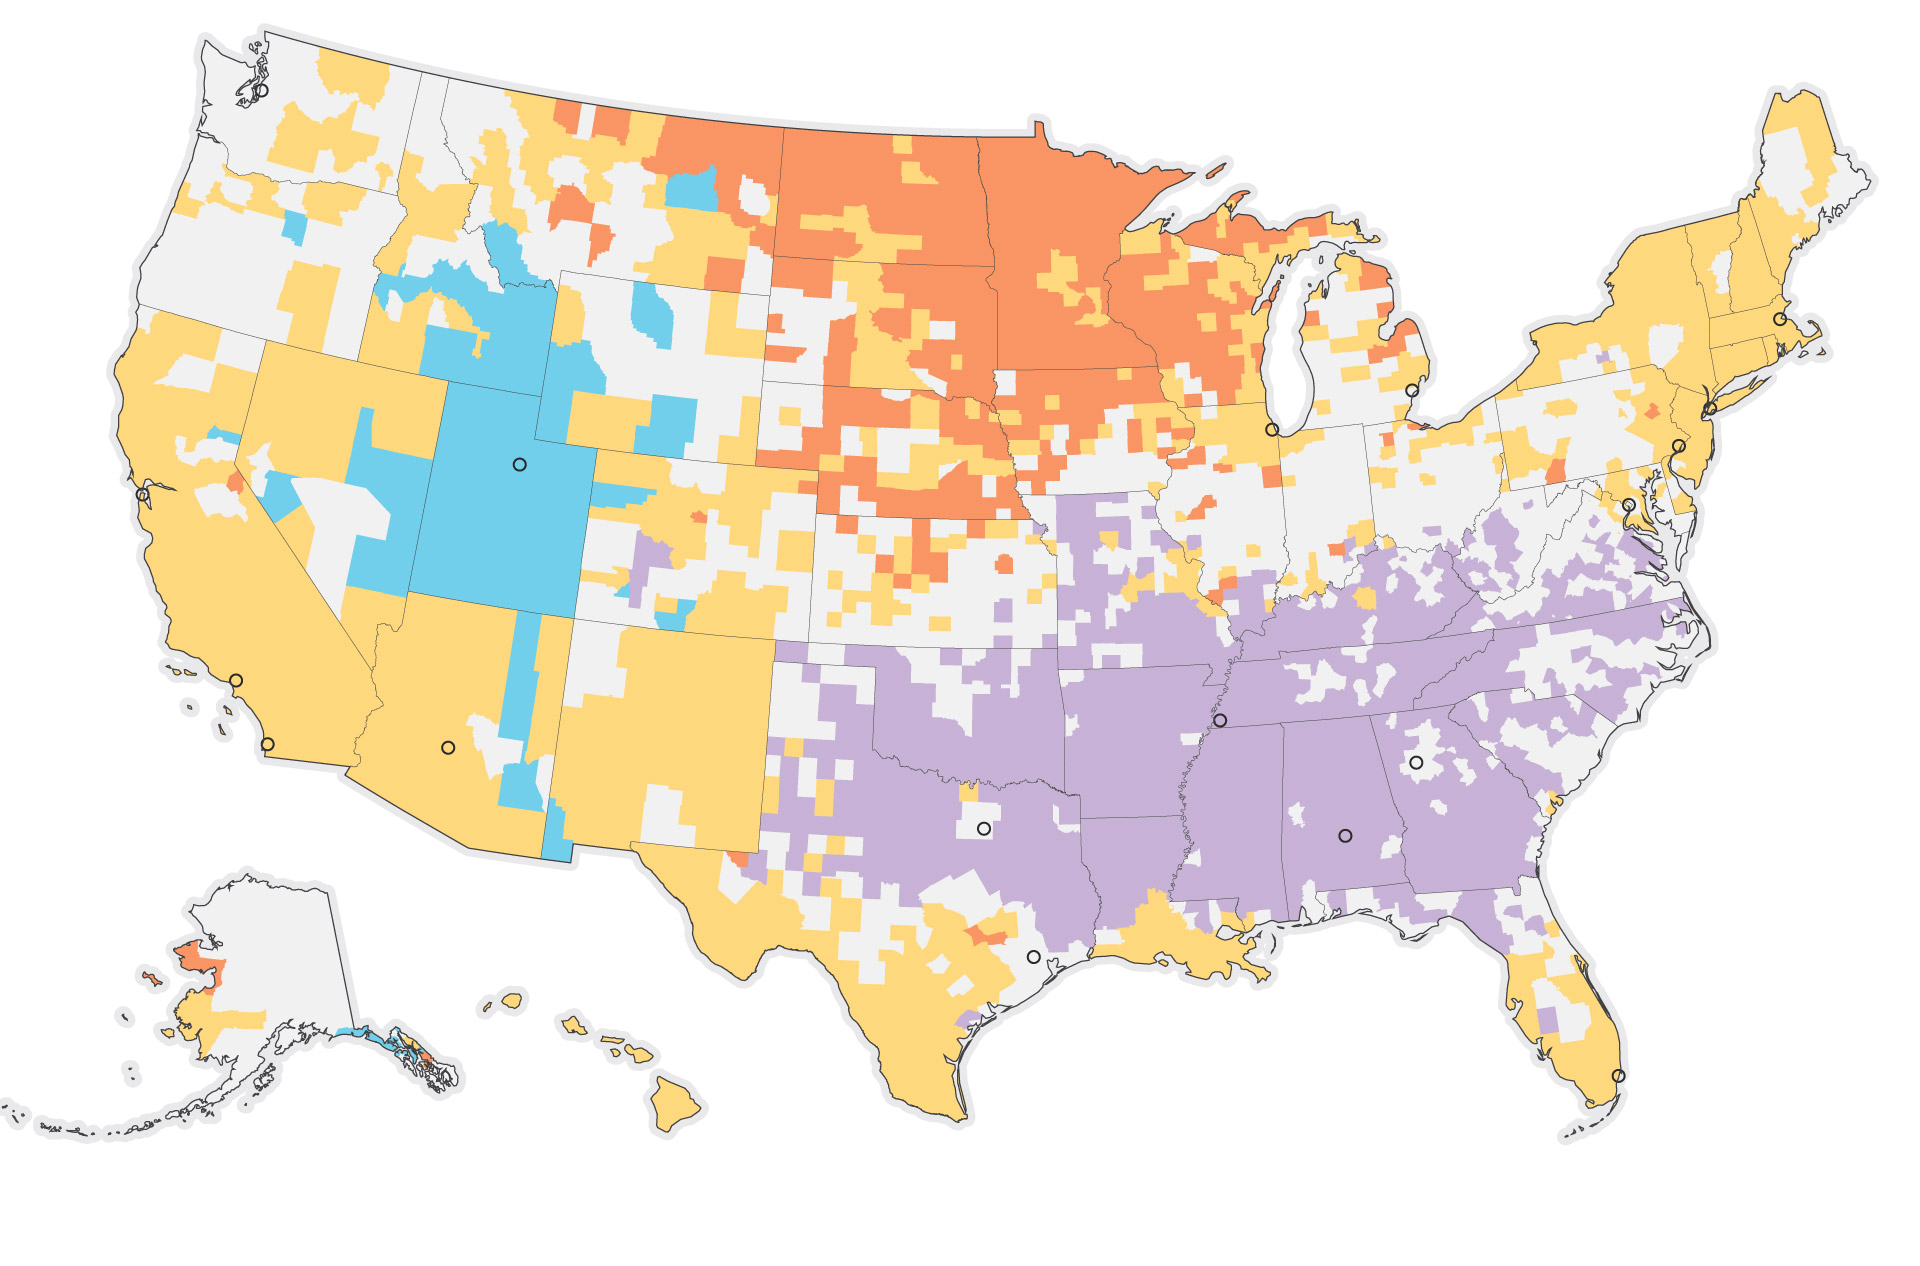
Main religious family by county
Source: 2020 U.S. Religion Census
DEPARTMENT OF DATA / THE WASHINGTON POST
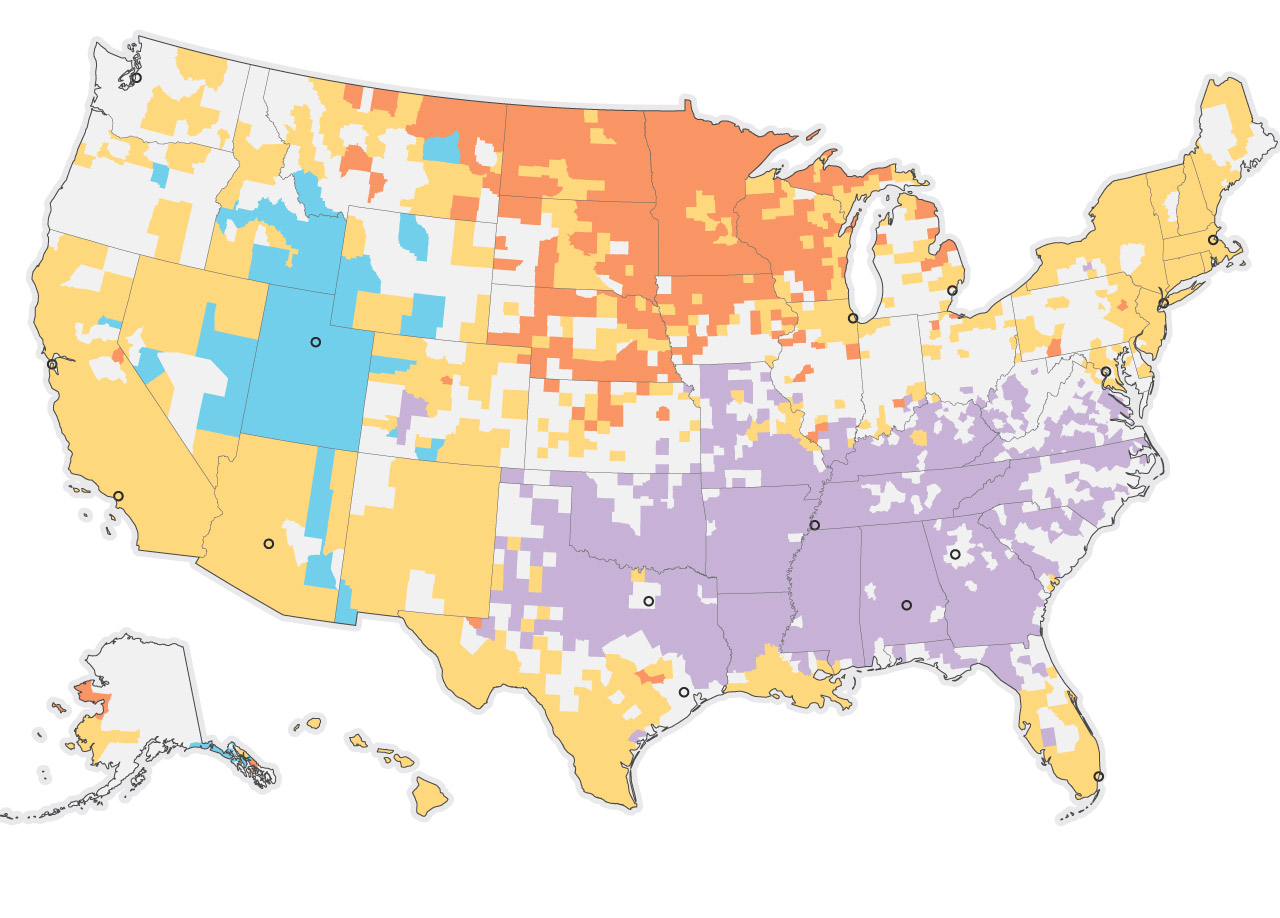
Main religious family by county
Source: 2020 U.S. Religion Census
DEPARTMENT OF DATA / THE WASHINGTON POST
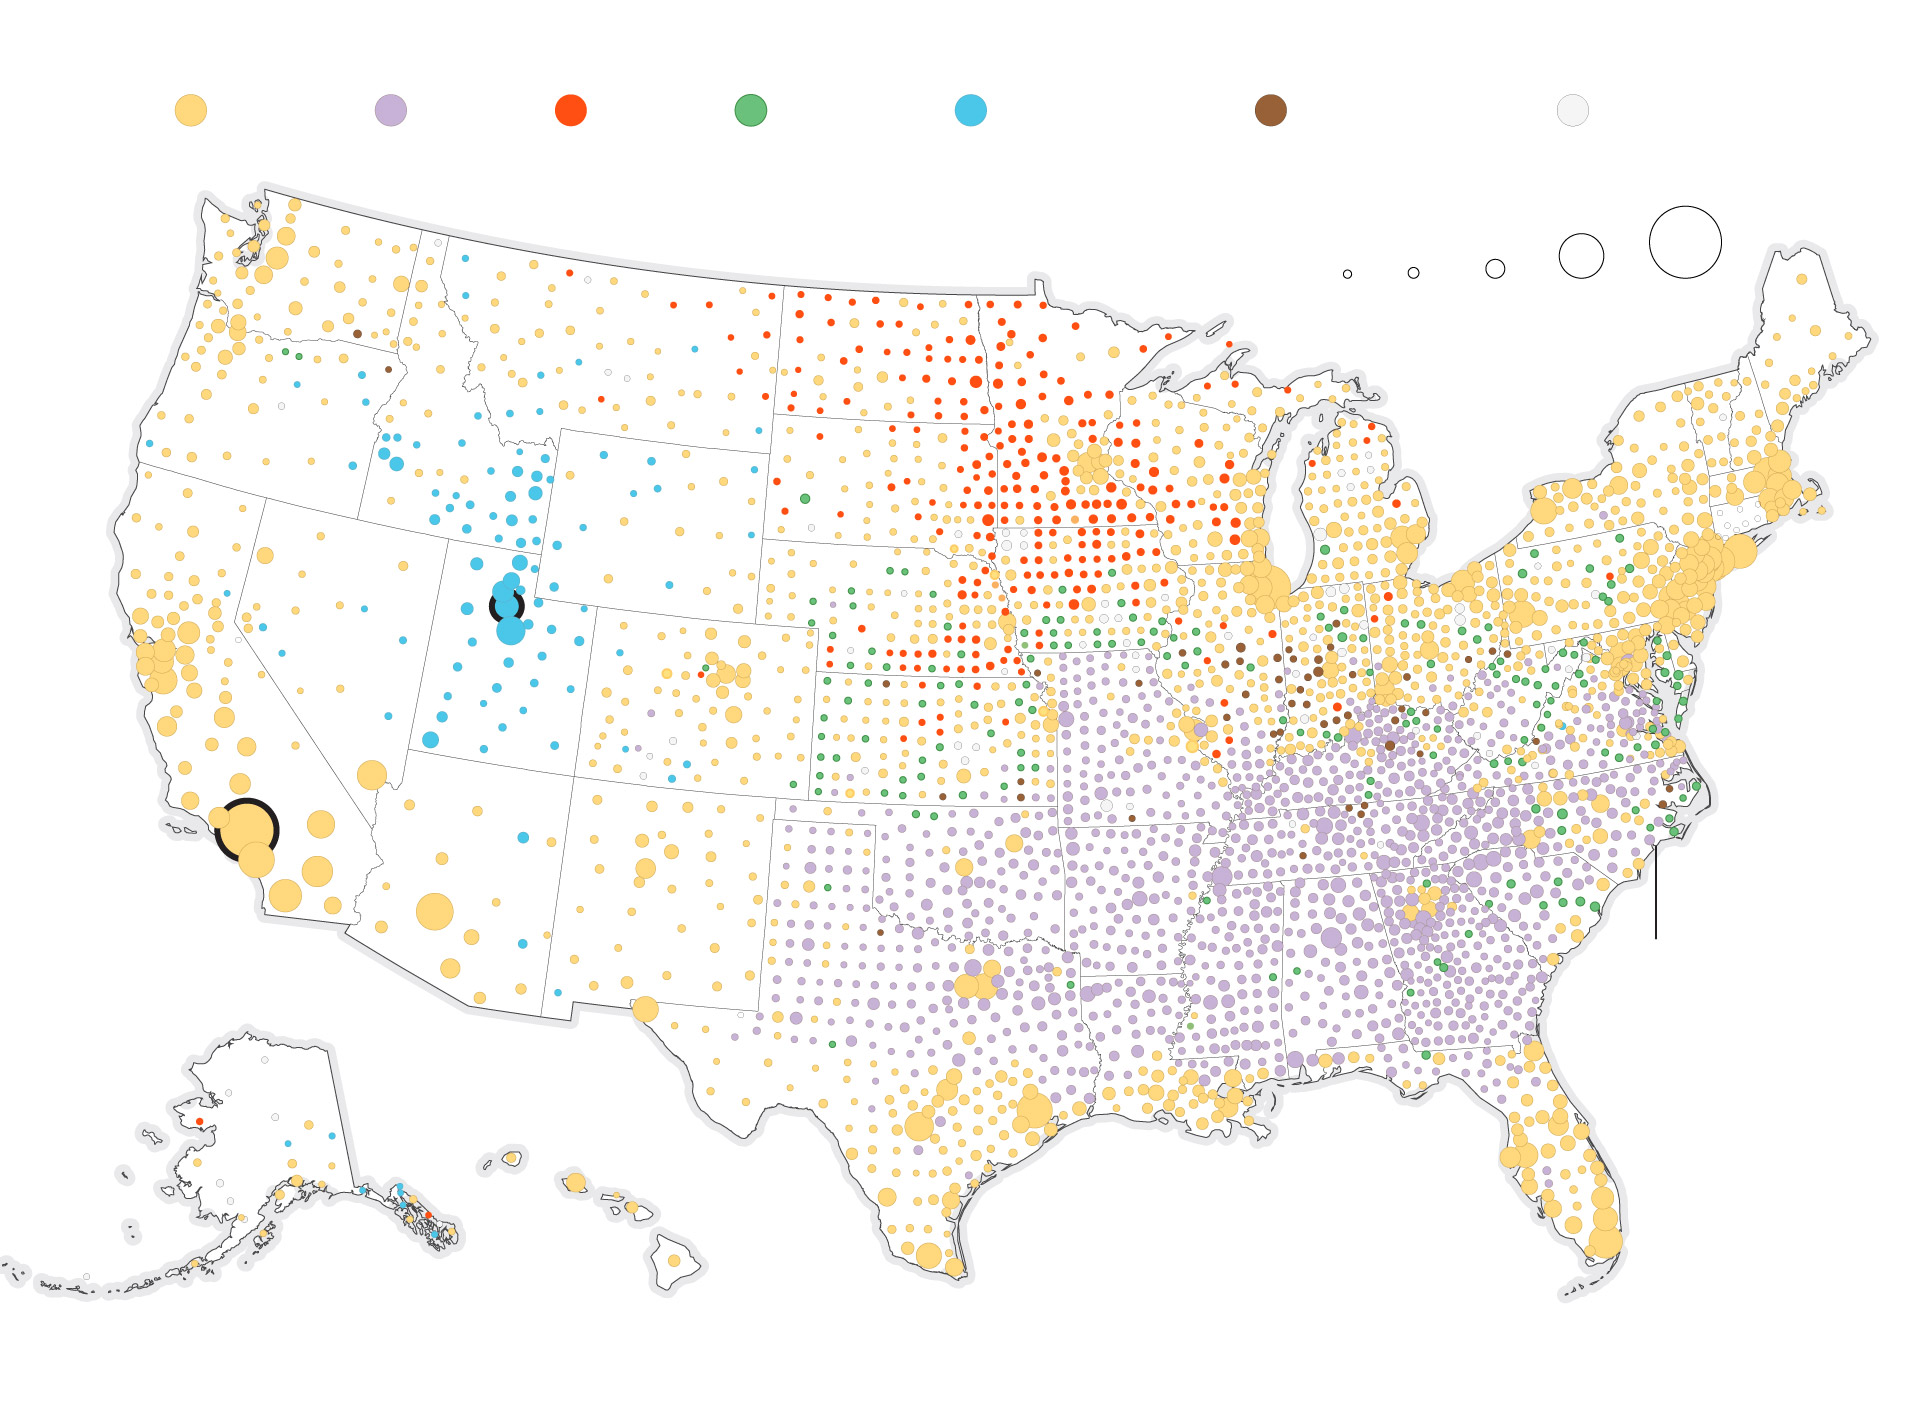
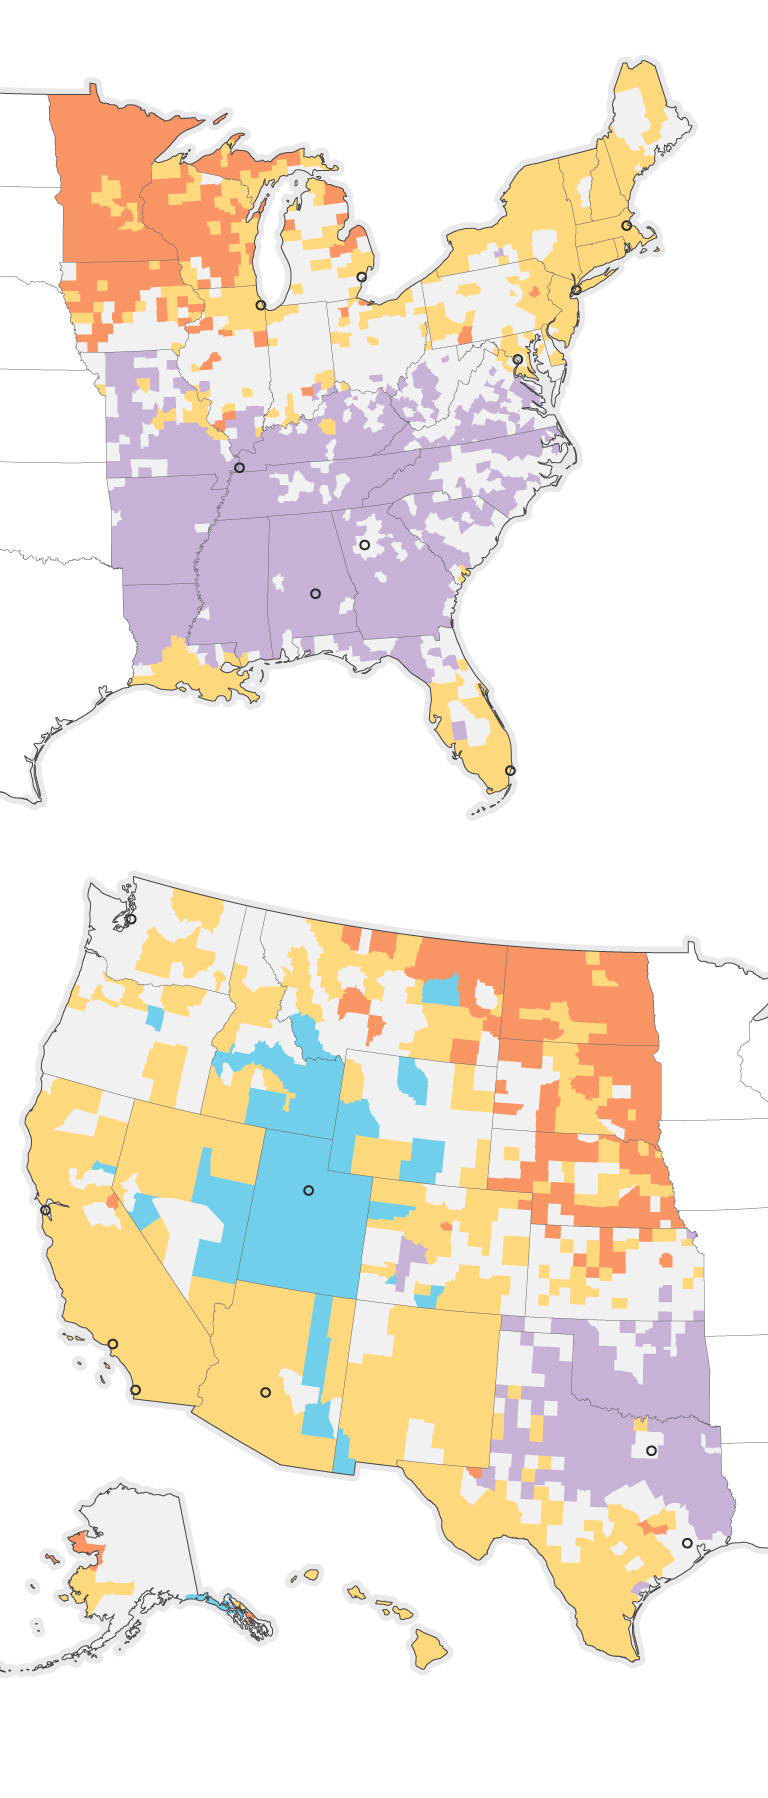
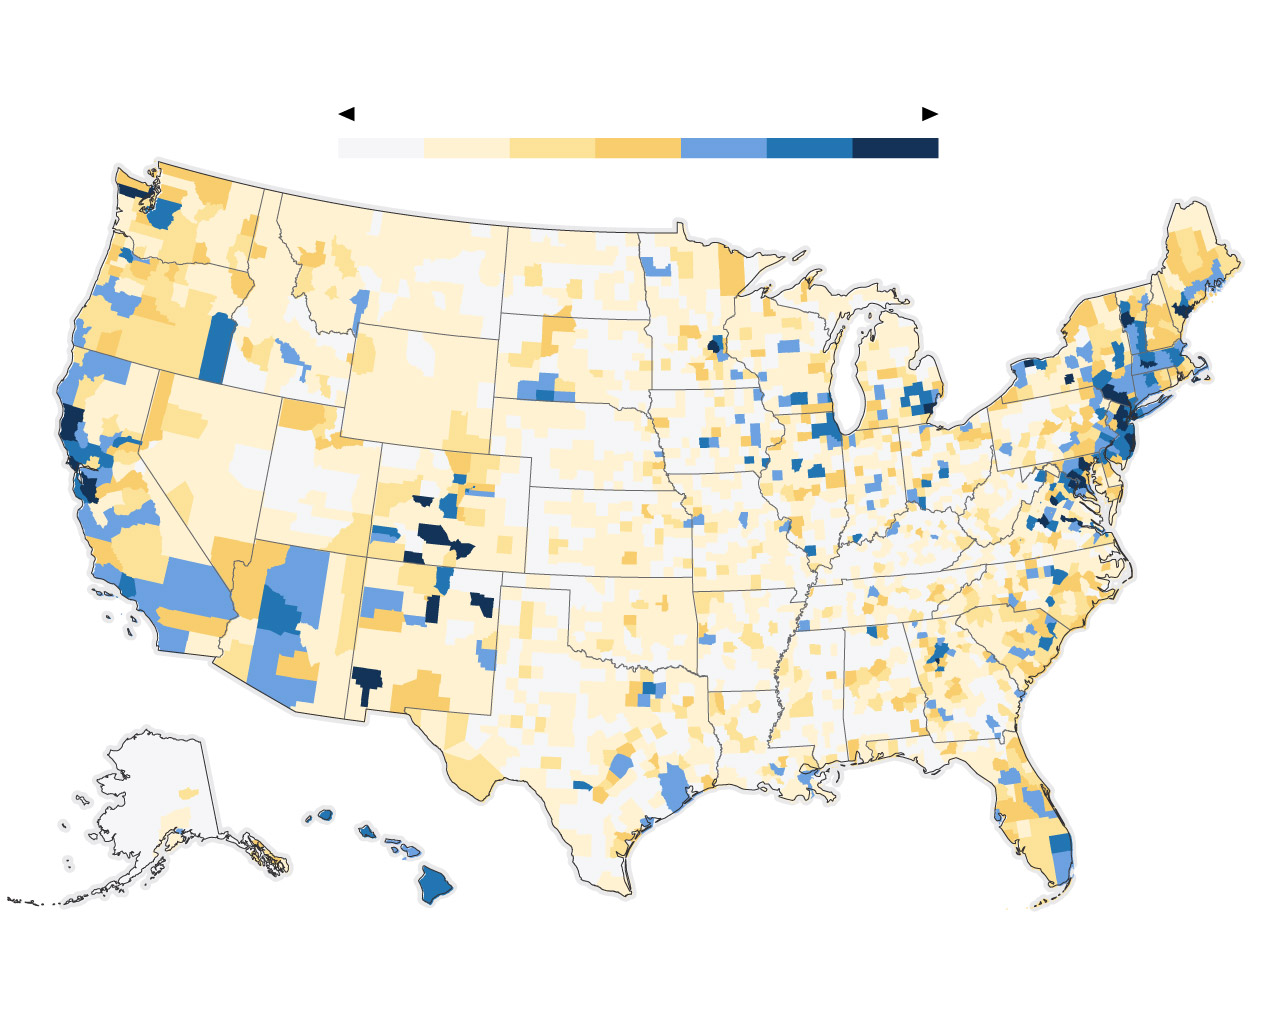
Main religious family by county
More than 650K
Mormons live in the
Salt Lake City
metropolitan area
There are more than
3 million Catholics
in Los Angeles
North Carolina is home
to one of the largest
Methodist communities
in the country
Baptists are the main religious
family in Southern states
Source: 2020 U.S. Religion Census
DEPARTMENT OF DATA / THE WASHINGTON POST
Protestants actually outnumber Catholics in the United States. But they’re splintered into at least 300 groups — including the Progressive Primitive Baptists, the Northern New Salem Association of Old Regular Baptists and the Fire-Baptized Holiness Church of the Americas — displaying a knack for division that might be expected from a religious tradition that owes its existence to the propagation of religious schisms.
This remarkable tapestry of devotion is woven from data collected for the U.S. Religious Census, which has been conducted every 10 years since 1990 by the Association of Statisticians of American Religious Bodies (ASARB), a far-flung crew of numbers enthusiasts from national church groups. The survey traces its roots to 1850, when the Census Bureau first conducted a count of religious bodies. The agency eventually produced a stand-alone religious census that collected data into the 1940s, until funding dried up.
Church groups scooped up the baton, with a dedicated core of statisticians working across doctrinal divides to pour thousands of hours into each census. Led by Cliff Grammich of the Catholic Glenmary Research Center and Rich Houseal of the Church of the Nazarene, the statisticians contact every religious body they can find in the United States, then pull additional data from marketing databases and web searches.
In the 2020 survey, they counted 372 religious bodies, 357,000 congregations and 161 million “adherents,” a broad category that includes synagogue, mosque, temple or church members, their children and other participants. Though they have no headquarters and no paid staff, the association’s statisticians possess almost infinite patience — which they needed when answering all our questions.
Varying methodology means their numbers aren’t perfectly comparable across religions, and they obviously can’t measure atheists, but it’s an incredible achievement by a shoestring operation facing some unorthodox hurdles. For instance, the clerk of a small protestant association once told Grammich he was risking the wrath of God, given that King David brought on a plague by taking a census of the Israelites.
“Often the work is appreciated by the faithful,” Grammich said, “but sometimes it may not be.”
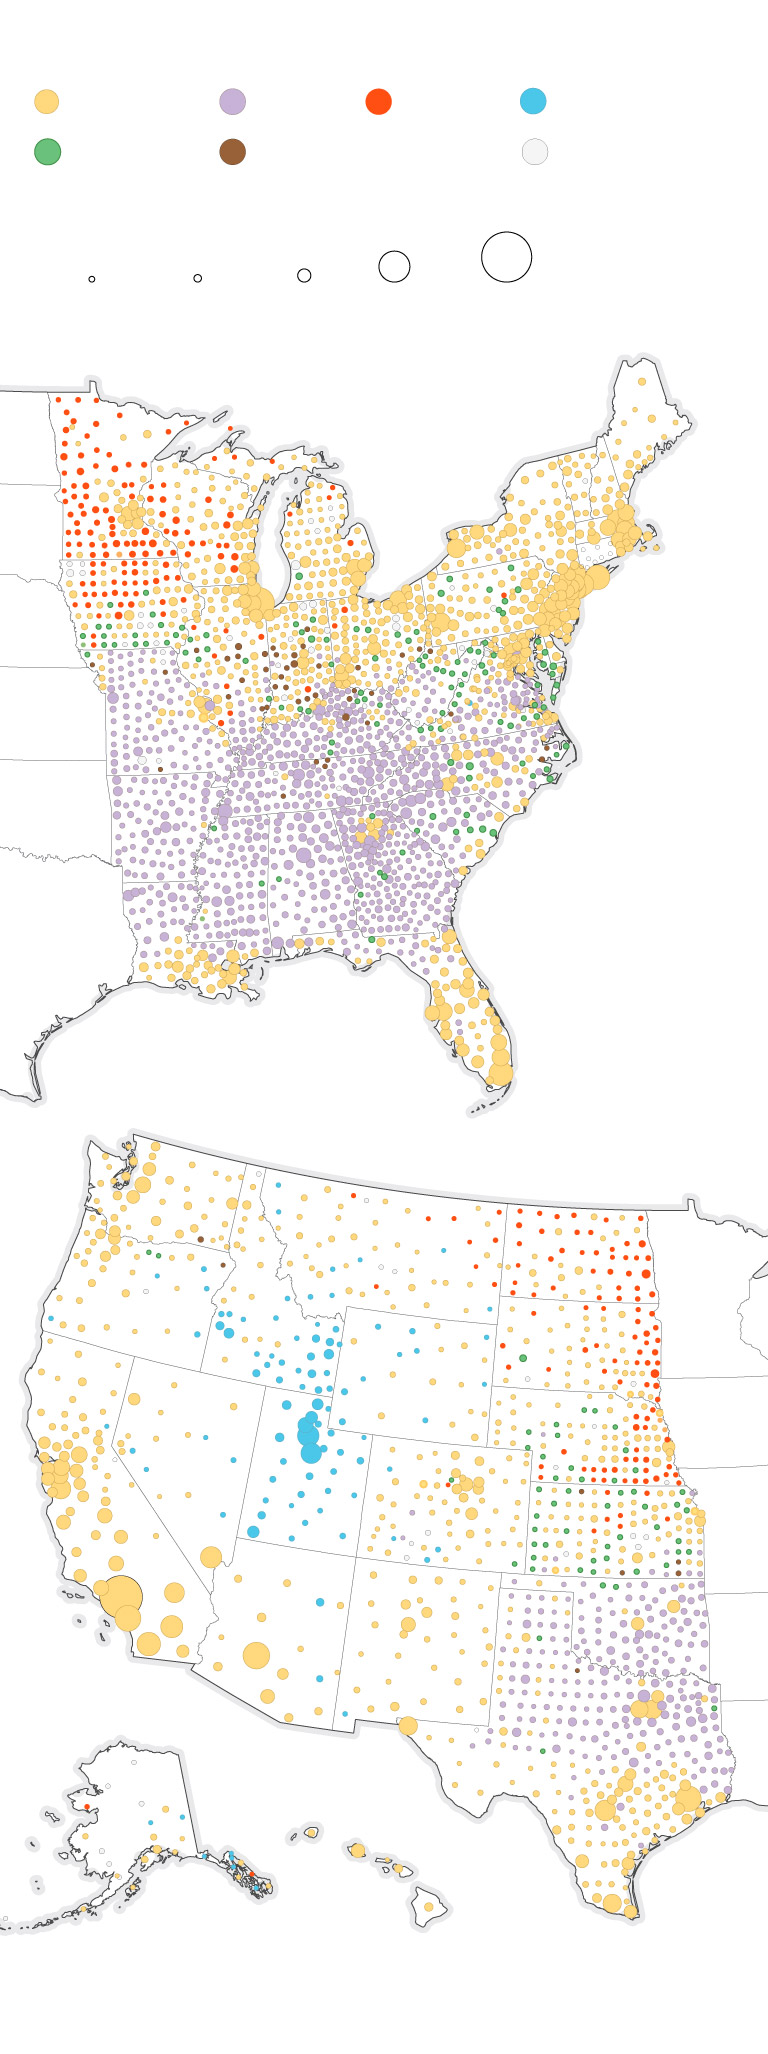
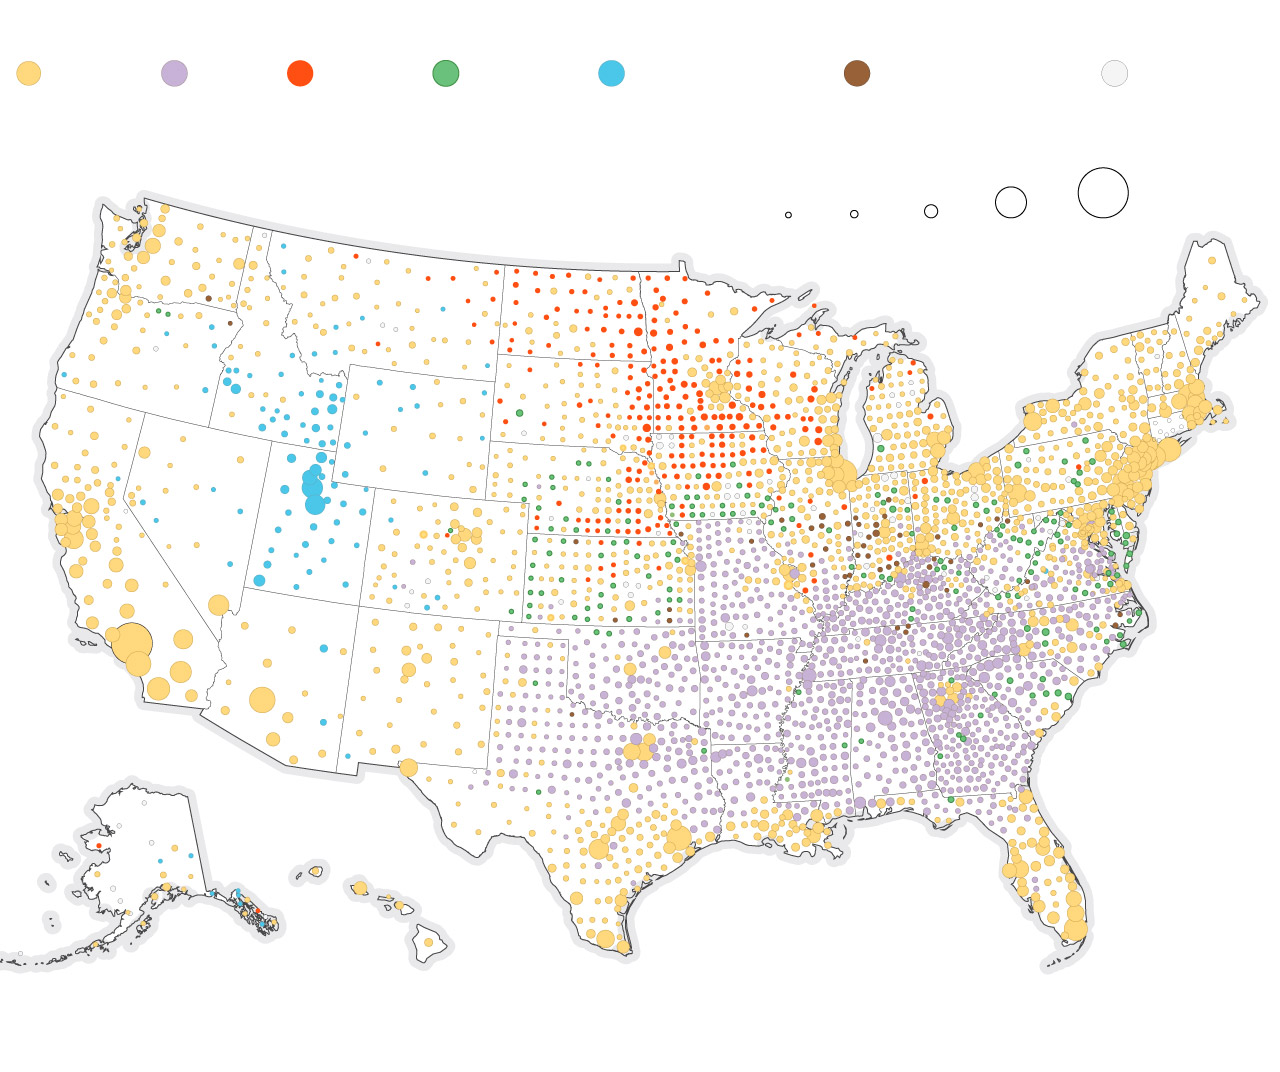
To wrap our heads around the survey’s phenomenal detail, we asked an algorithm for help. It split U.S. religions into five clusters, with big blobs of Baptists in the South, Lutherans in the Upper Midwest, Mormons around Utah and Idaho, and — of course — Catholics everywhere.
Source: 2020 U.S. Religion Census
DEPARTMENT OF DATA / THE WASHINGTON POST
Source: 2020 U.S. Religion Census
DEPARTMENT OF DATA / THE WASHINGTON POST
Source: 2020 U.S. Religion Census
DEPARTMENT OF DATA / THE WASHINGTON POST
Source: 2020 U.S. Religion Census
DEPARTMENT OF DATA / THE WASHINGTON POST
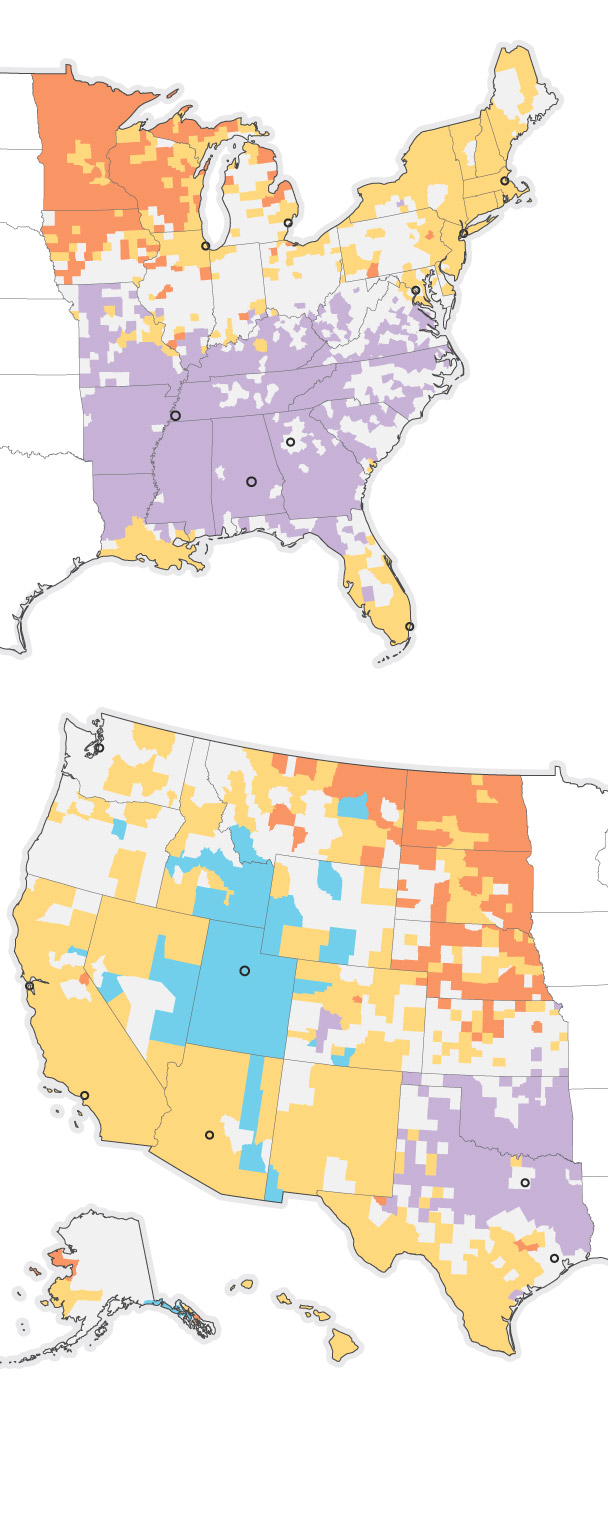
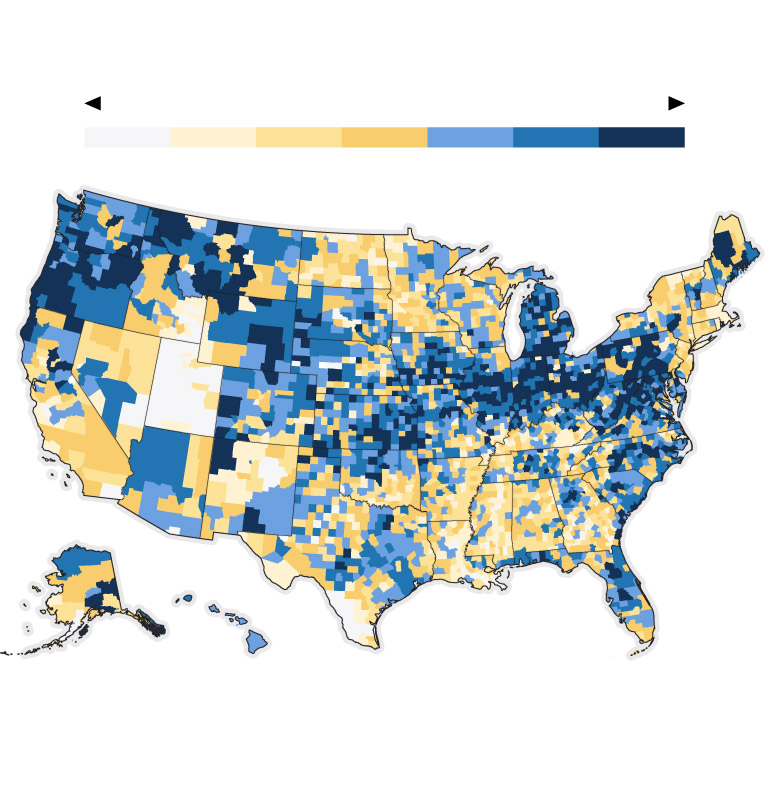
Scattered among them are vast stretches where, true to the nation’s founding principles, there isn’t a dominant religion. When you rework our county-by-county map to show levels of religious diversity, those areas show up as dark blue. Conversely, Mormon country stands out as the least religiously diverse part of America (along with the heavily Catholic Rio Grande Valley).
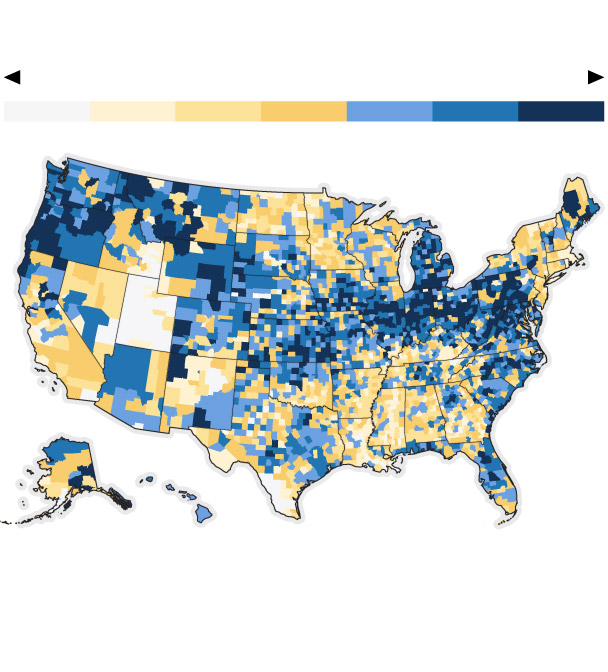
Source: 2020 U.S. Religion Census
DEPARTMENT OF DATA / THE WASHINGTON POST
Source: 2020 U.S. Religion Census
DEPARTMENT OF DATA / THE WASHINGTON POST
Source: 2020 U.S. Religion Census
DEPARTMENT OF DATA / THE WASHINGTON POST
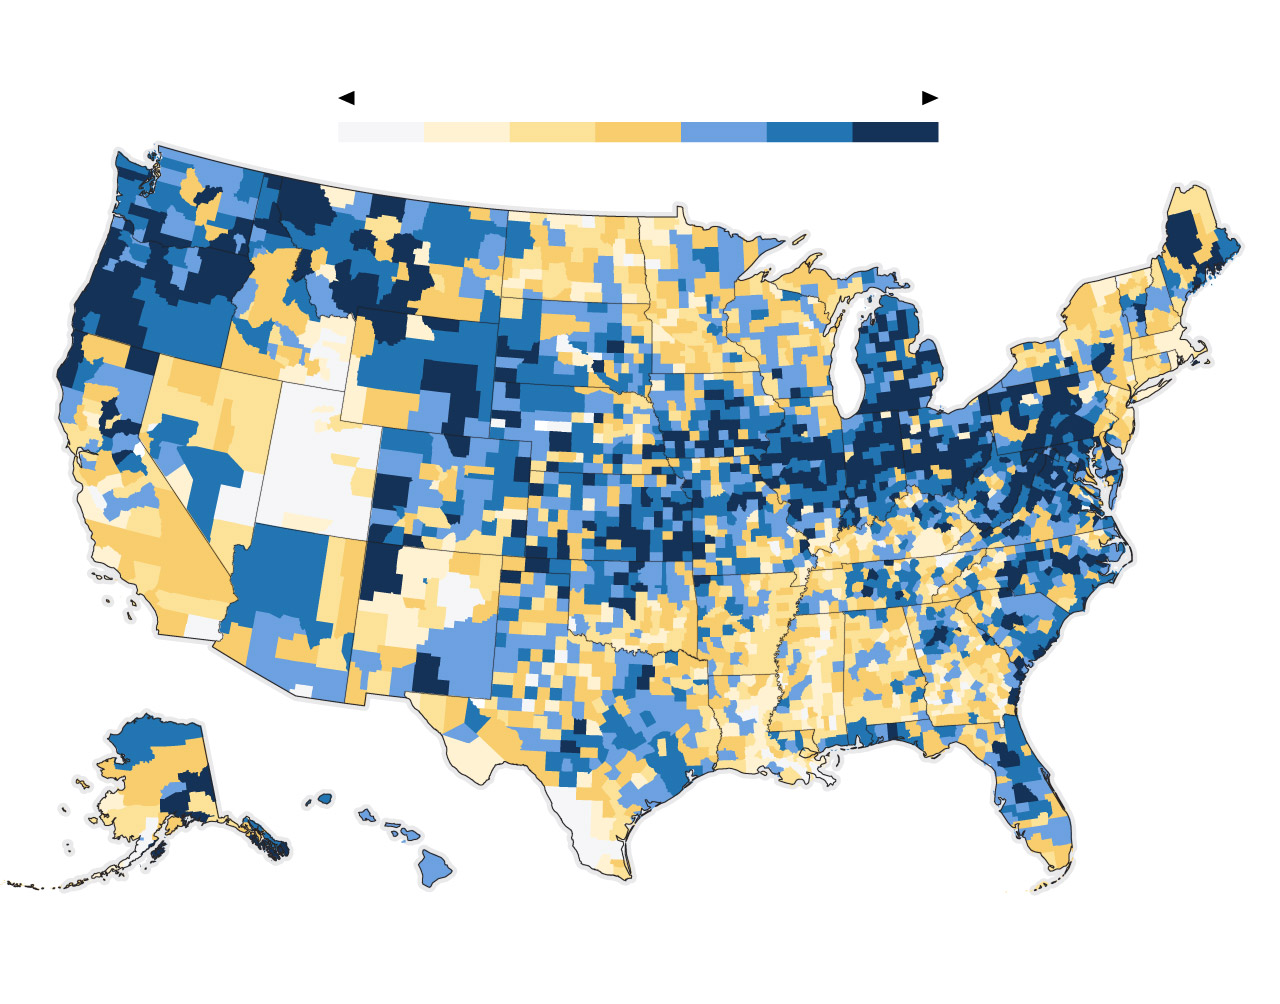
This map may give the impression that America, home to the world’s largest Christian population, is a hotbed of ecclesiastical balkanization. But if we regard Christianity as a single monolith — lumping all the Catholics, Presbyterians, Methodists, Lutherans and whatnot in one big sacramental wine jug — we find that the most religiously diverse places in America are generally the big cities. The urban Northeast leads the pack.
Religious diversity if all Christian faiths
are grouped together
Source: 2020 U.S. Religion Census
DEPARTMENT OF DATA / THE WASHINGTON POST
Religious diversity if all Christian faiths
are grouped together
Source: 2020 U.S. Religion Census
DEPARTMENT OF DATA / THE WASHINGTON POST
Religious diversity if all Christian faiths
are grouped together
Source: 2020 U.S. Religion Census
DEPARTMENT OF DATA / THE WASHINGTON POST
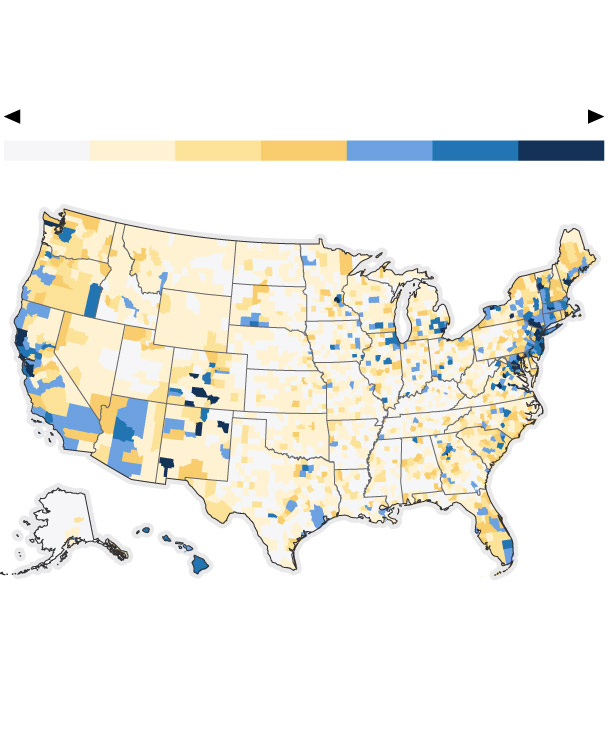
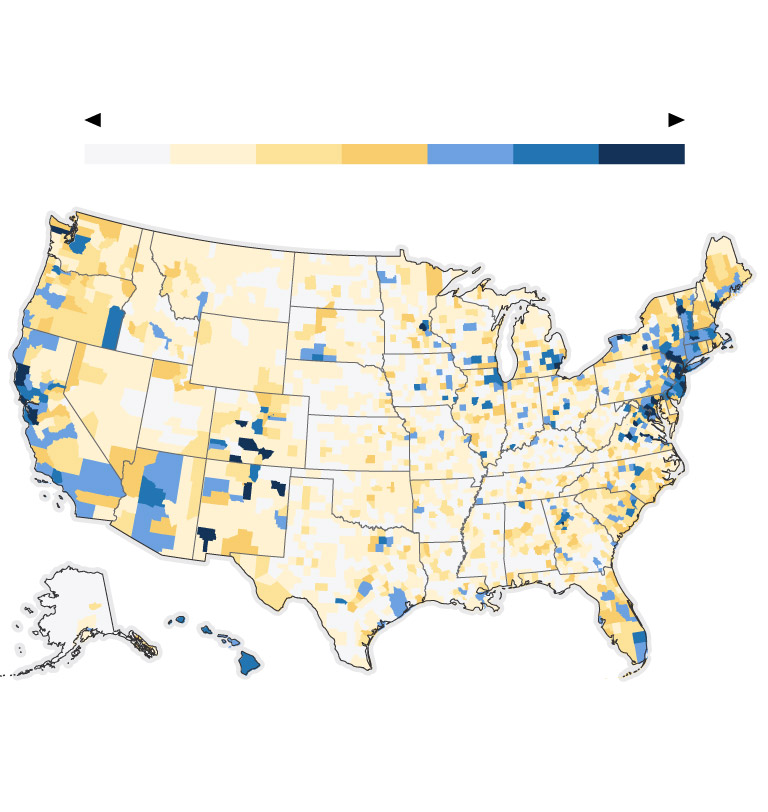
That’s because if America has a Quran Belt, a Torah Belt or a Bhagavad Gita belt, greater New York City forms its buckle. Almost half of America’s Jews, by synagogue adherence, live in either New York or New Jersey — which also happen to be the second and third most Islamic states, after Illinois. And they’re in the top three for Hindu Americans (along with Delaware). The Buddhists stick to the West Coast (and D.C.).
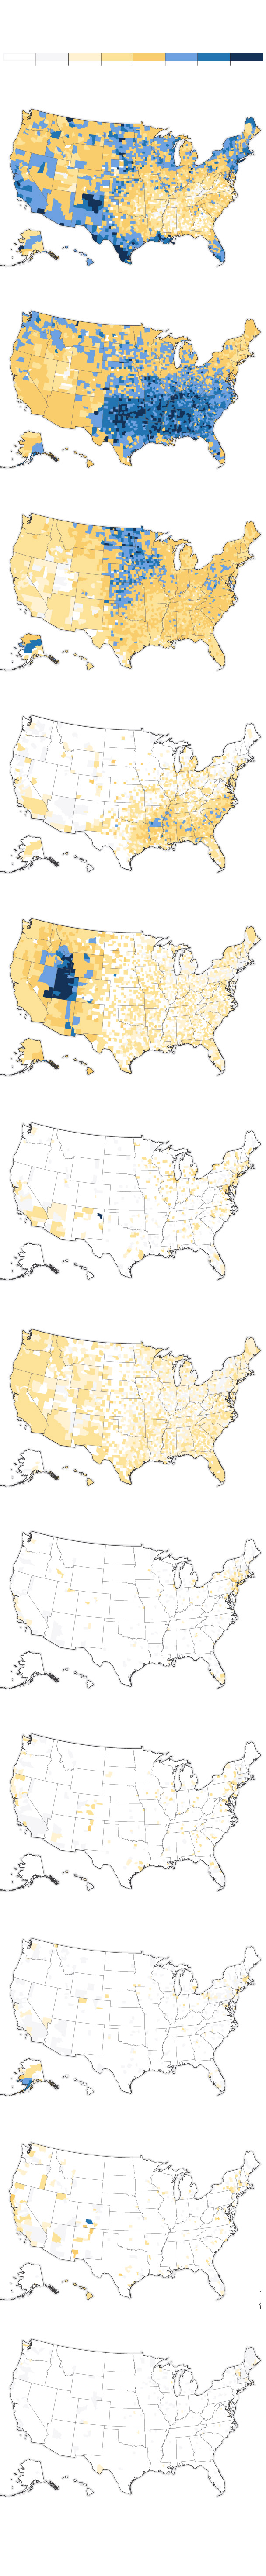
Adherents by religious family
as a share of population
Source: 2020 U.S. Religion Census
DEPARTMENT OF DATA / THE WASHINGTON POST
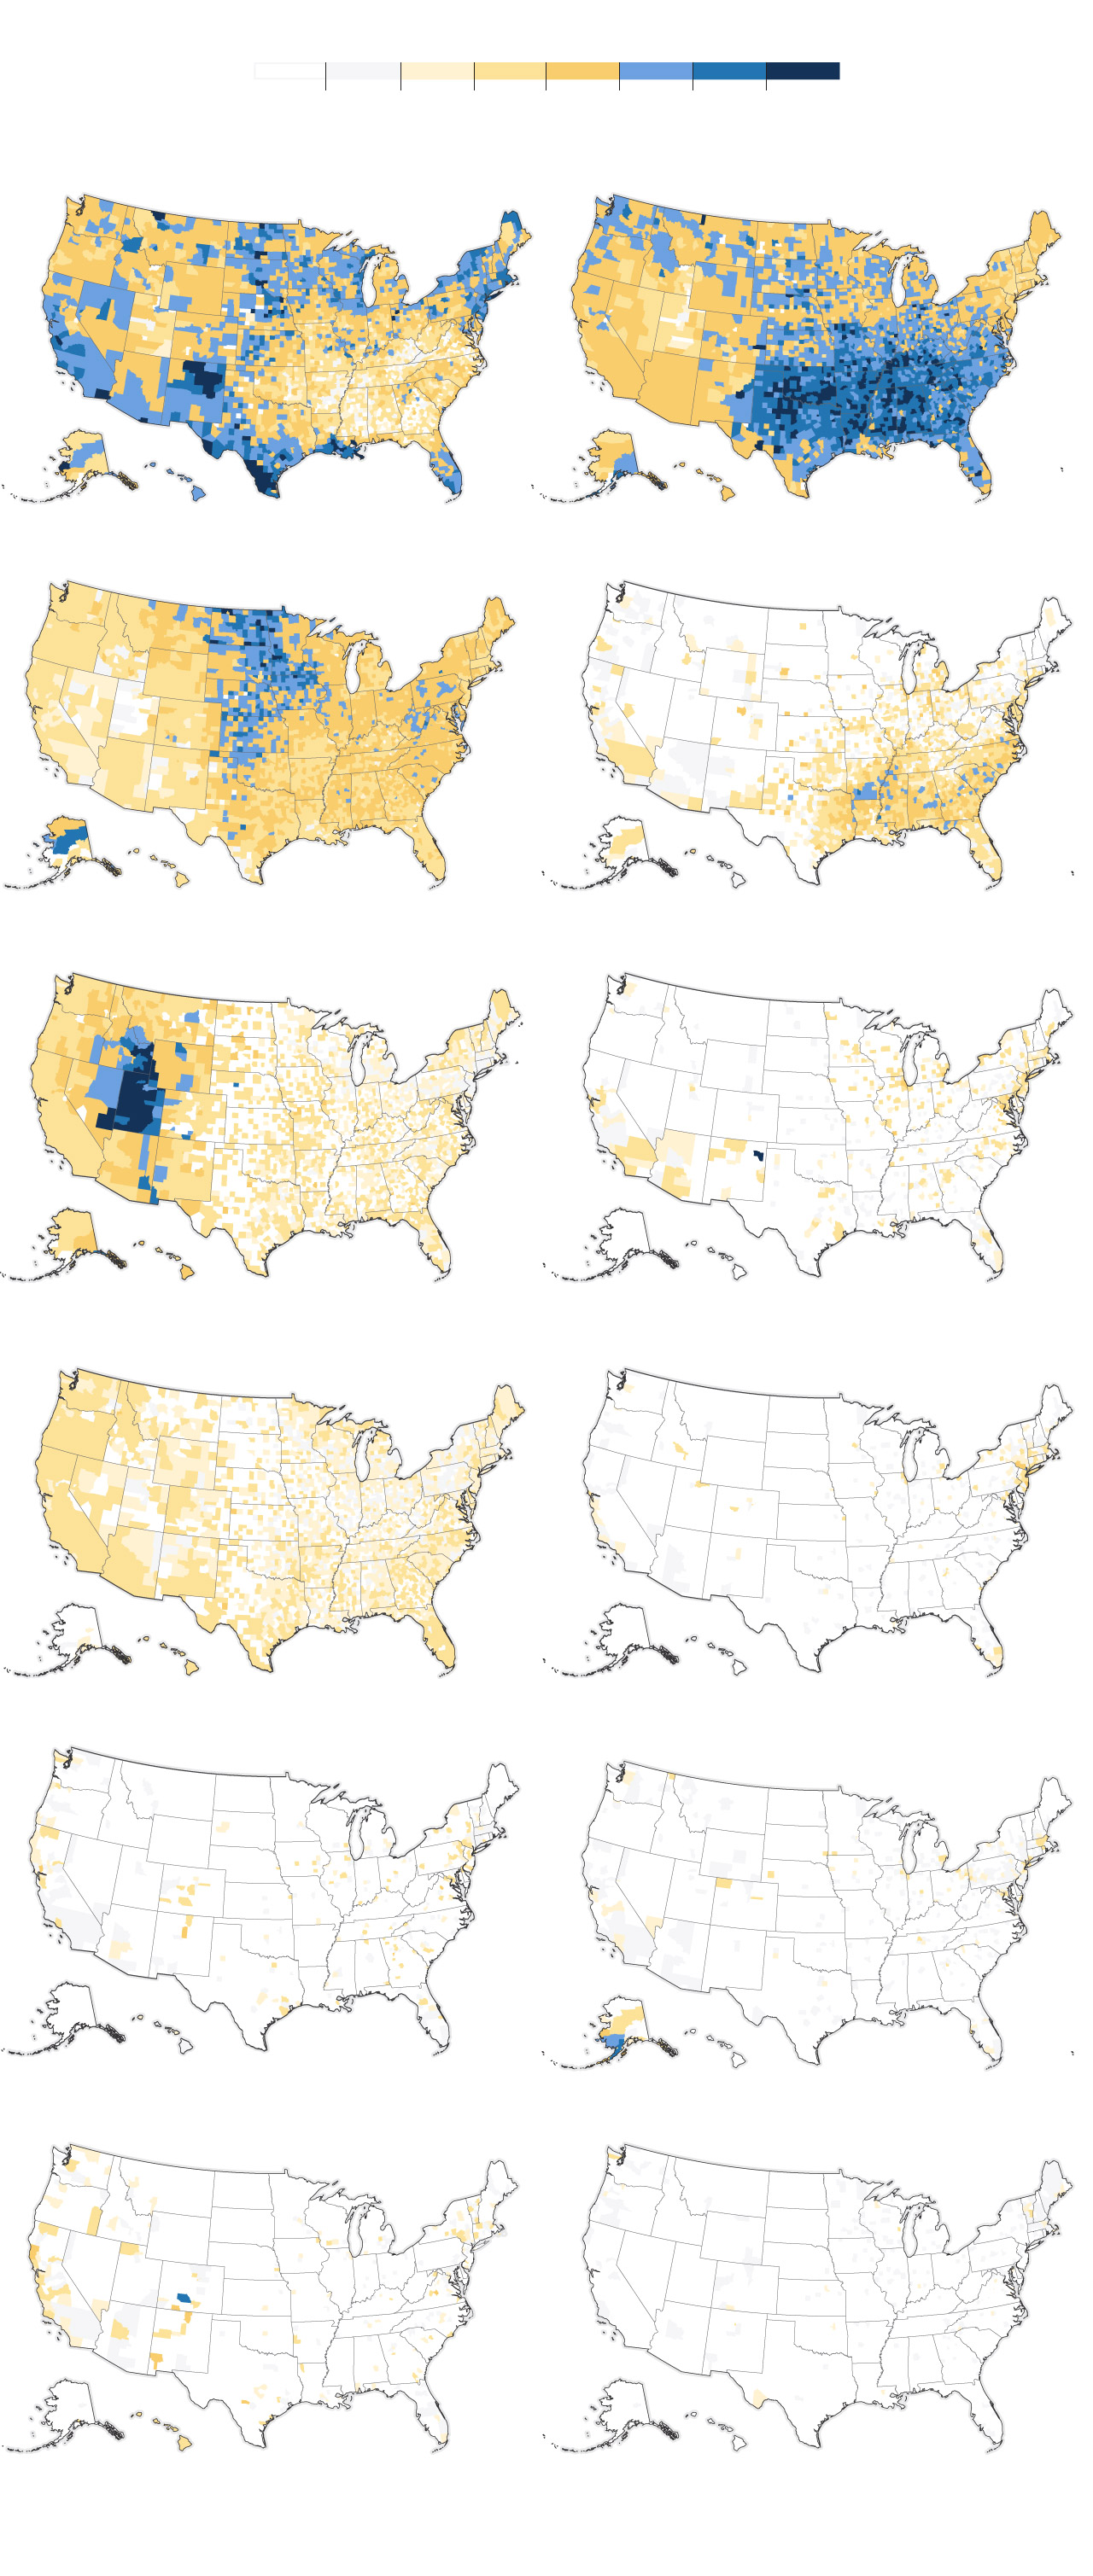
Adherents by religious family as a share of population
Source: 2020 U.S. Religion Census
DEPARTMENT OF DATA / THE WASHINGTON POST
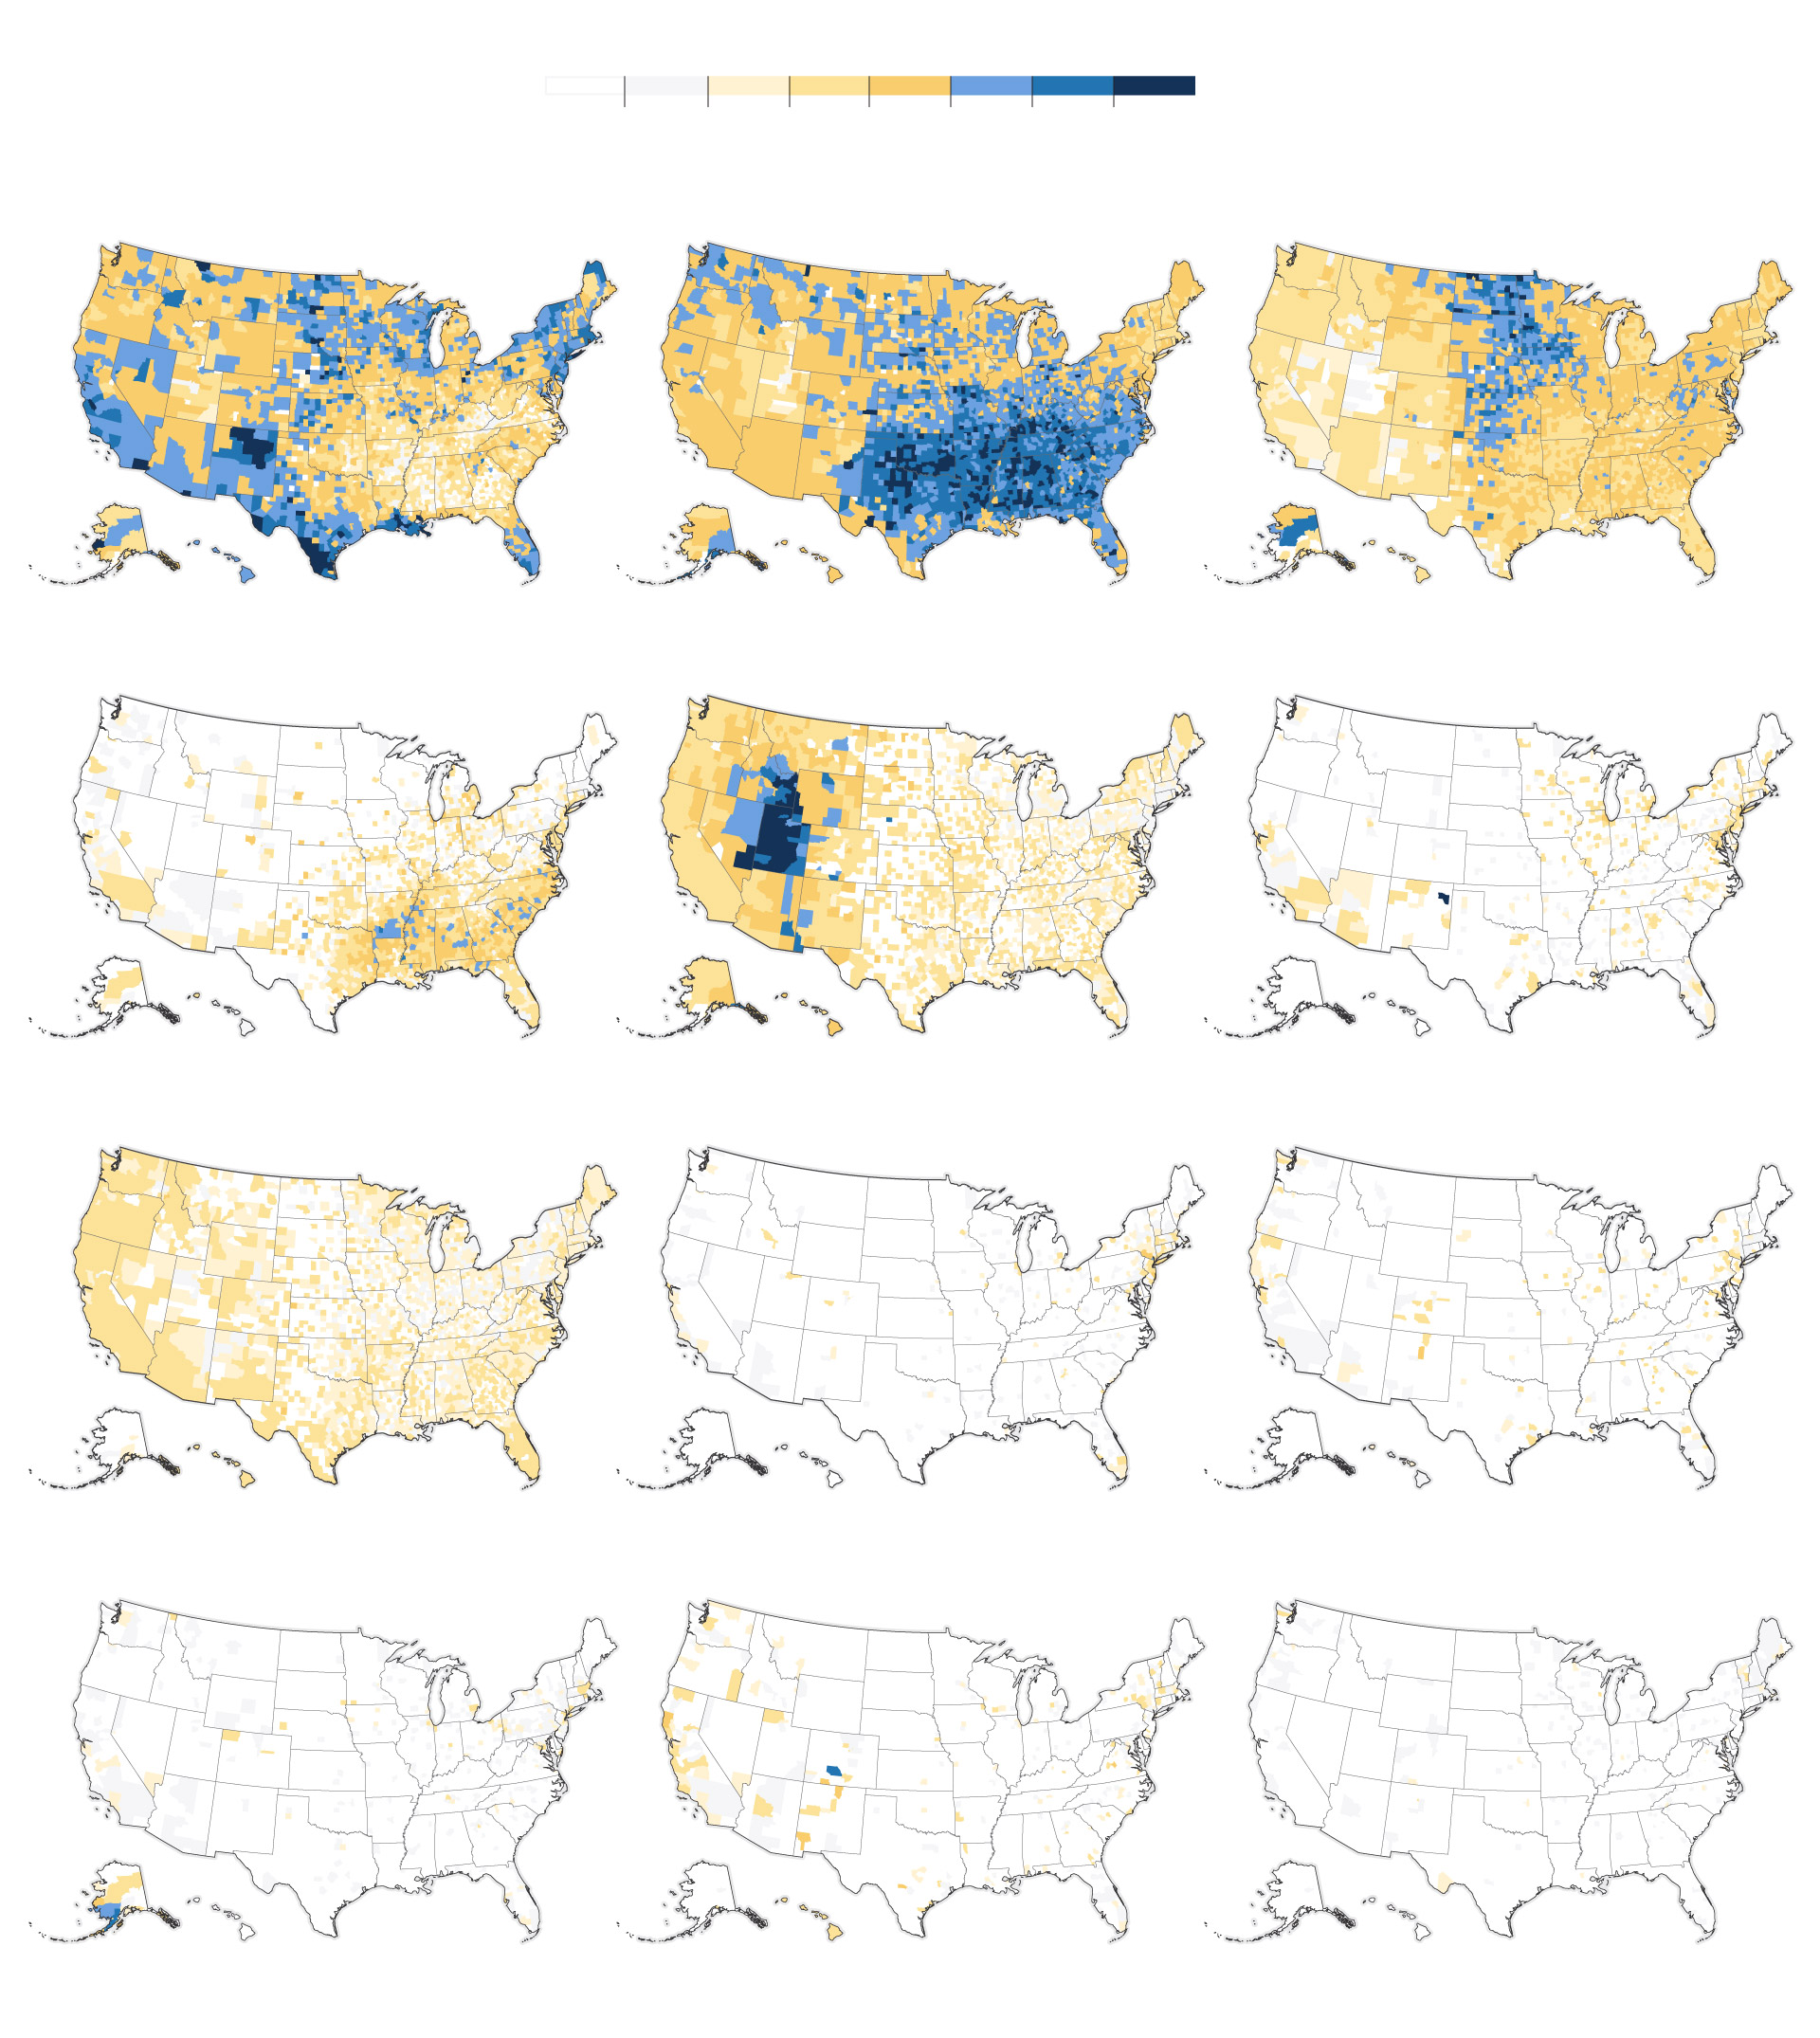
Adherents by religious family as a share of population
Source: 2020 U.S. Religion Census
DEPARTMENT OF DATA / THE WASHINGTON POST
These geographic patterns help intertwine religion with politics. If you map religious affiliation alongside voting patterns, you find that more Christian areas tend to be a bit more Republican, while areas with larger non-Christian populations tend to be deep blue. Exceptions abound, of course: Historically Black Christian denominations, Catholic churches, Reformed churches, Friends churches, Anglican churches and Orthodox churches all concentrate in more liberal areas.
In fact, Christianity’s strength in conservative country comes mainly from Methodists and Baptists. They’re the two biggest protestant sects, unless you count “nondenominational,” a fast-growing catchall that includes many megachurches. Thanks to its history of rural circuit riders, the United Methodist Church is the most widespread in America. Its presence in 95 percent of counties makes it common in conservative rural regions regardless of the denomination’s politics.
What about general trends in churchgoing? Religious adherence, based largely on membership records, remains steady in America, with 49 percent of households declaring allegiance to one religion or another, said Erica Dollhopf, ASARB president as well as data and analytics director at the United Church of Christ. That’s down only slightly from 50 percent in 2000. However, other sources show that the unchurched are on the rise. The long-running General Social Survey from NORC at the University of Chicago shows that the share of Americans claiming no religious affiliation has doubled since 2000, from 14 percent to 28 percent.
Why do the numbers seem to contradict each other? They may be measuring different things. For starters, it’s not clear that claiming adherence to a religion guarantees presence in the pews. For a look at church attendance, we called Devin Pope, an economist at the University of Chicago’s Booth School of Business. (And no, to answer your inevitable question, Pope is not Catholic.)
While conducting covid-related research, Pope acquired (anonymous) cellphone tracking data showing the movements of 2.1 million Americans in the 47 weeks before the coronavirus storm hit. For a new working paper, Pope and a squad of students spent hundreds of hours categorizing 392,000 U.S. worship sites by religion, then used the anonymous phone data to determine how often people visited them.
When stupendous survey outfits such as Pew or Gallup ask about church attendance, about 21 to 24 percent of Americans say they go at least once a week. But everyone we spoke with agreed that folks tend to exaggerate their physical dedication to devotion. Pope’s work puts regular churchgoers in America, even before the pandemic’s shift to remote worship, at as little as 5 percent of the population.
That figure inevitably undercounts attendance among certain devout groups, including the Amish and their plain brethren, who generally frown on cellphone use, and Orthodox Jews, who habitually turn their phones off on the sabbath.
“My guess is the numbers in the paper are biased downward by a small amount because of people not taking their phones to church,” Pope told us, noting that a survey he ran on how often people take their phones to church suggests that true visit counts are as much as 20 percent higher.
Still, that would point to fewer than 10 percent of Americans hopping in the car (or horse-drawn buggy) to go to church (or mosque, or synagogue) every Sunday (or Friday, or Saturday). But take any estimate with a grain of salt. It’s not a random sample and phone tracking, while innovative, could have technical issues, said methodology expert Philip Brenner, who wrote his dissertation in part on the biases that confound attempts to measure religious attendance. The real number lies somewhere between the cellphones and the surveys, Brenner said.
And weekly attendance can vary dramatically across religions. About 2 percent of Catholics went to Mass every week — a little higher than Muslims, Orthodox Christians and Jews, according to Pope’s research — but well below the 15 percent of Mormons who regularly worship in person or the 7 percent of Protestants and Jehovah’s Witnesses.
A much higher share of Americans show up less regularly, often on holidays. Total weekly synagogue attendance roughly doubles for the High Holy Days, peaking at Yom Kippur, while mosques see over 50 percent more people in the prayer halls during Eid al-Fitr (the end of Ramadan) and Eid al-Adha.
Pope couldn’t fully disentangle America’s web of Christian sects. But of those he could identify, Catholics see the biggest holiday spikes, with attendance leaping more than 50 percent for the weeks of Easter and Christmas. Orthodox churches see a similar surge on Easter, while Protestants tend to have smaller spikes. Attendance by Mormons and Jehovah’s Witnesses doesn’t so much as flinch.
Why do the Catholic masses seem to spurn Catholic Masses? We hassled our friend Stephen Spiewak, last seen supplying stats on orchestras in the Midwest. He now works for the popular Catholic prayer app Hallow, putting him in a neat position to speak on Catholics’ worship habits as seen through cellphones.
Spiewak notes that Pope the Chicago researcher counts only those who attend weekly services on each religion’s primary day of worship (e.g. Friday for Muslims, or Friday evening and Saturday for Jews) plus holidays. Pope the Supreme Pontiff, on the other hand, regards Saturday vigil Mass as equivalent to Sunday Mass for meeting believers’ weekly attendance obligations (per Canon Law 1248).
Pope the researcher’s calculations show that if he counted Saturday visitors, typical Catholic attendance would rise by about 30 percent. If he included any day of the week, it would go up by about 60 percent, roughly in line with what we see for other religions.
Just for fun, Spiewak built a bespoke data set of worship times in a couple of American cities. Out of 55 churches he found in Jersey City, 17 were Catholic and all but 2 offered Saturday evening Mass. None of the other churches had a Saturday night service.
“If you were to ask a Catholic if they went to Mass this Sunday,” Spiewak said, “don’t be surprised if they say ‘Yes, I went on Saturday.’”
Experts also pointed to another likely reason for attendance gaps: differences in how many members are “ascribed,” or assigned to that religious tradition almost by birth, as with low-attendance groups such as Catholics, Jews or Muslims, and those that “achieved” their religious status by choice, as is more common among Mormons and other missionary or evangelical sects.
Hi! The Department of Data craves questions. What are you curious about: Which “international” airport least deserves the name? Are record numbers of people moving to the United States from Canada? Why do school closures lead to higher alcohol sales? Just ask!
If your question inspires a column, we’ll send you an official Department of Data button and ID card. This week’s envelope goes to R.W. in Arizona, who reads the column “religiously” and told us “I would find it interesting to know the distribution of religions by region and equate it to the political divide.”
